
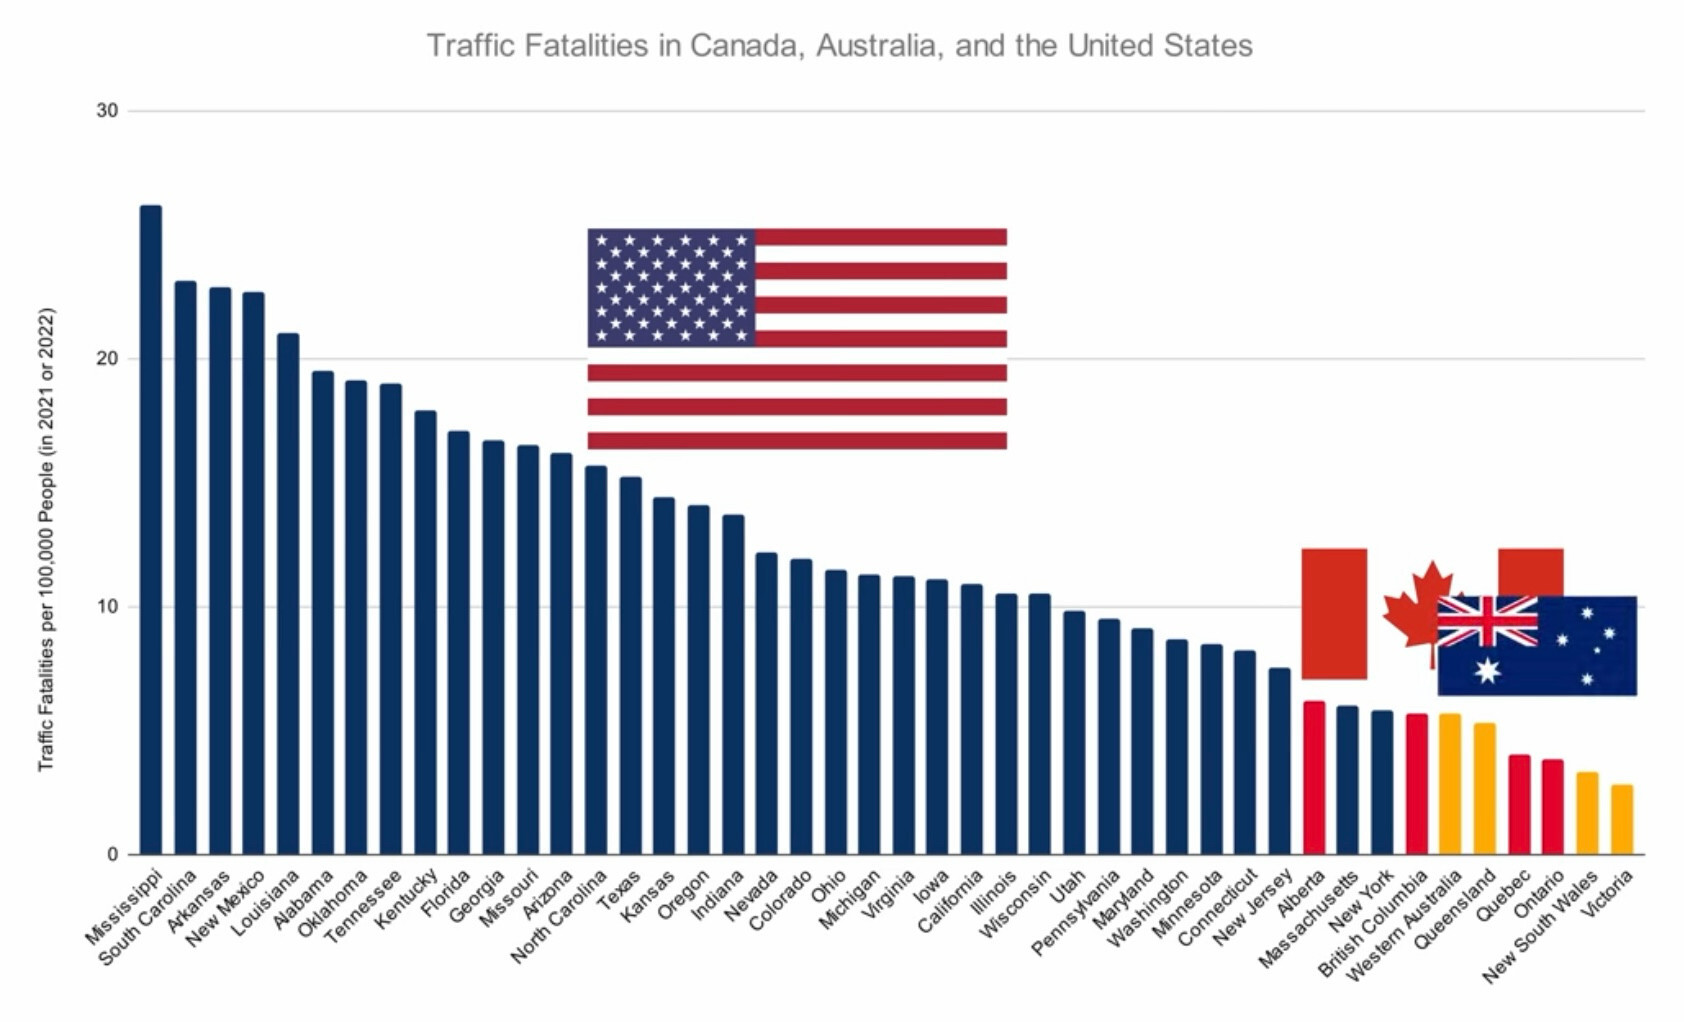
Mississippi is always the worst of any statistic
Mississippi is the only state that doesn’t specifically prohibit drinking and driving (as long as you stay below the 0.08% BAC)
deleted by creator
That might be skewed as most of their population are in New York City, and more than half of the city doesn’t even own a car.
That’s pretty much the point of the chart. Better public infrastructure decrease the deaths from cars.
Or commuting accidents in traffic are rarely fatal.
Both? Both. Massachusetts is right up there as well, and while Boston isn’t as large or dense as NYC, a full 50% of the workforce in Boston commutes every day using the T. That’s a huge portion of the people who go into and out of Boston daily from outside suburbs and towns who aren’t on the roads.
I understand this is largely due to Americans wanting to get drunk like everyone else but also having to drive everywhere.
And gigantic motor vehicles.
And terrible roads and/or regulations? I can’t help but notice the worst offenders are conservative areas and those usually are neglectful.
The transportation departments of red states just funnel the monies to corrupt buddies and nothing gets fixed even though there is perpetual road work being (performatively) done.
And lack of pedestrian infrastructure, and…, and… We can go on and on at how baked into the cake these deaths are in the car cult.
There are so many dumb regulations and circumstances that functionally push people to giant vehicles.
For instance: I replaced my 2016 VW golf base model with an electric F150 this year for a multitude of reasons. I got a refund from insurance (with the same coverage). None of this makes sense except that I’m less likely to be injured by other motorists in my 3.5ton truck. I found this depressing.
Thought it would be interesting to compare with EU, they published an article in 2023 (https://ec.europa.eu/eurostat/statistics-explained/index.php?oldid=630784) with the following data. This graph uses a number per 1 million inhabitants so divide by 10 to compare it.

As far as I know Finland has the world’s strictest driving licence, so I’m actually surprised to see it posting worse statistics than Sweden here.
Sweden went insane with road security in the nineties (nollvisionen?) so maybe that’s why.
I really don’t see what’s insane about that to be quite honest
Sweden is as expected. 200-something fatalities for 10 million people. Norway stands out😃
It got me thinking about definitions, though. For Sweden every death during transportation is counted (including busses, heavy trucks and single accidents with a bike), while the definition my 2 minute googling found for Canada said deaths resulting from accidents involving automobiles.
The stats are normalised for per 1 million inhabitants are they not?
But your second point is definitely very good. I imagine getting consistent fully comparable numbers from all the various countries isn’t easy.
Need to factor in terrain and weather conditions too.
Like should it really count if I was driving uphill in the snow? Absofuckinglutely not.
The way this chart is formatted is making me more angry than it should lol
How is norway so low?? We have mostly trash roads with a few noteable exceptions. Cliff on one side, river or fjord on the other. No shoulder worth mentioning unlike sweeden, that often have half a lane on either side of the road.
Maybe scarier roads make you drive slower?
driving requirements for license are vastly different among european countries, but also state of the cars, more wealthy nations replace older cars more quickly, so countries like Bulgaria and Romania often sit on their cars for sometimes generations. Add to that the constant honking and cutting off people, temperament of the populus
Victoria is that low cos they don’t fuck around when it comes to driving fines. The speed limit means limit, and they’re cracking down hard on drivers using phones.
Victorians are some of the worst/dangerous drivers I’ve seen, but I’m not in Victoria.
I have seen worse but yeah, we have more than our fair share of dickheads on the road.
Yeah the only people worse at driving are Belgiuns. I say this with certainty having never been to Belgium and in direct conflict with the source presented to me. I simply know it to be true as an empath.
I mean,Australia has way less snow than the US, that definitely has to account for a chunk of the difference in our numbers.
Is this specifically relating to the difference between Victoria and Mississippi?
Between Australia and the US in general.
from existing in a car in the US on a few occasions and living in australia i’d wager a HUGE amount of the difference is attitude… holy SHIT do yall speed like crazy! 15-20mph over the limit just seems to be standard… 15kph over the limit here in aus you literally watch them pass every other car and call them a dickhead - and they’ll almost certainly get a speeding fine
I am Australian, Ive been doing track days, drift days and have done a few amateur rallys too over the last 20 years and Ive never been more scared driving than a rental car in Austria in winter on holiday. Ice and snow is a whole different skillset.
also true, but as other have said, mississippi doesn’t really get snow so given the massive difference between them and vic, i don’t think snow is really a particularly big contributor
But Canada has way more snow than the U.S., so that doesn’t seem to be a major factor.
Could be that Canada is ready for the snow it gets while you see some states shut down completely when they get a light dusting of snow.
Yeah this is what I’m getting at.
Canadians and northern states know how to drive in snow and in general can afford more comprehensive plowing and salting programs. Mississipi is both broke AF and gets snow rarely.
So the programs suck and so do the drivers.
Mississippi gets negligible amounts of snowfall and it rarely sticks.
Im not saying its THE cause, just that the US as a whole has to regularly deal with a potential cause of accidents that is almost non-existent in Australia.
We also have a significantly lower amount of bear attacks and it has nothing to do with the quality of our bear management programs.
but significantly more dropbear attacks. perhaps that puts the fear into you and keeps you driving better.
I remember reading years back that Mississippi is the only state where it’s legal for the driver to drink while driving (as long as they keep it below 0.08). Multiple defenders on Reddit said its safe because its still below the legal limit.
Couldnt be related, could it? Nahhh
https://dui.drivinglaws.org/resources/can-a-passenger-drink-alcohol.htm
I don’t know much about Mississippi, but I know that in neighboring Louisiana, there are drive-through daiquiri places.
the fine print of the law says that the open container law is not applicable to containers with frozen alcoholic beverage where the lid is intact and no straw is protruding through the lid.
In most cases, daiquiris adhere to the “tape rule.” Most daiquiri shops will put a piece of tape over the straw hold on the lid. If this tape is removed or broken then the drink is considered an open container.
So a piece of tape counts as a “seal.” They’re not even trying.
Ah yes, a piece of tape. Tape can definitely not be lifted and replaced, right?
I took a quick looks and seems like Mississippi has many drive through daiquiris bars also.
https://m.yelp.com/search?cflt=drivethrubars&find_loc=Gulfport%2C+MS
Mississippi has many drive through daiquiris bars also.
Looks like we just found another piece of the puzzle. Thanks for checking on that! I didn’t know Mississippi also had them, but it’s all making sense now.
Wait, are you saying BAC while driving must be 0.00 in some parts of the States, or am I misunderstanding? It’s 0.05 in most (all?) parts of Australia (except if you’re in a restricted licence category). It’s not encouraged, but it’s legal.
Figured you guys would have more permissive laws than we do.
No I’m saying you’re not allowed to be drinking alcohol while you drive. Which you are in Mississippi.
USA freedom warriors ™ on Reddit say ‘that’s fine because they still have to be under the legal limit’. Unable to fathom that the idea of normalizing drinking alcohol while you drive encourages irresponsible behaviour amongst other negatives, beyond just staying under the BAC limit.
Ahhh, yeah, that’s a bit cooked. The freedom warriors bit isn’t surprising, though. You’d expect them to be in favour of “the freedom to be as irresponsible as you like”.
getting a drivers license in mississippi is basically show up to the DMV, suck a cock and drive home or what?
Mississippi has drive-through combo shops: liquor store / DMV / KFC.
Saves time on your way to and home from church.
21 Mississippi, 22 Mississippi…

Took a closer look to see if I was surprised by any correlation about poverty, and browsed away with the belief that the south is still a shithole… which might still correlate with poverty. I think kansas/oregon is the first entry that wouldn’t be ‘south.’
Drinkin’ beers an’ drivin’ yer trukk is a highly traditional pastime in the US deep south. Typically done in the middle of the night, in my experience, for the maximum probability of contacting the local wildlife or making friends at high speed with a tree.
America is more in the middle of the road when you look at the whole globe, and don’t just select a few counties with lower death rates.
https://en.wikipedia.org/wiki/List_of_countries_by_traffic-related_death_rate
Africa is currently the reigning champ for vehicle related deaths.
Yes, but that does not make it any better, since the US should be compared to other Western developed countries. That is like people saying that the number of gun deaths in the US isn’t that bad because they are worse in Ukraine or Syria, you know, active war zones.
I think it’s fair to compare like with like. Many African countries have poor infrastructure, inadequate enforcement of traffic laws, rapid urbanization, unsafe vehicles, and limited emergency medical services. Its easy for a Western country to look better compared to that, but is it a fair comparison?
Well, if you’re comparing the US south, it might be fitting.
That’s not fair. Blue state tax pays have paid for some really nice infrastructure down there.
The Netherlands has 4.19
The Netherlands is close in size to Maryland, and close in the number of inhabitants as New York. Also half of the traffic is cars and half is bicycles. It’s pretty insane how bad Mississippi is.
I tried looking into why Mississippi was so far worse. Mostly just finding people self report texting and driving more there, infrastructure is shitty, enforcement is shitty, DUIs are high they recently just upped the civil fine of texting while driving from $25 to $100.
For fun I looked to see what Mississippi would be like if it was its own country, and do to GDP it was compared to Morocco and Kenya.
Car Deaths per 100,000
Mississippi: 26 Morocco: 17.29 Kenya: 28
Kenya is 4x as dense as Mississippi is though, so still hard to say Mississippi is safer than Kenya. It’s just numbers
tried googling it also and prompted “which state is easiest to get drivers license?” and one answer was “probably washington, you dont have to parallel park there, just attempt it” and it told me everything I need to know about the safety of US roads
That’s a good amount of states, at least 10 I’m sure. Parallel parking in the U.S. is rare. I remember my mother telling me in her late 50s she had never done it since her driving test back in 77. I used to do it when I’d go into cities but it is rare to find anywhere that requires it. Some vehicles are also so big here that if someone parallel parks a truck 5cm off the curb cars will have to drive into oncoming traffic to go around them. Thankfully places are starting to crack down on that.
didnt even think about too wide cars using parallel parking in cities. I mean we have the occassional F150 in Munic downtown blocking all trams and traffic because they can’t fit europoor parking lots, but it’s always a spectacle and the owners are more often than not scolded for driving these into crowded spaces where they clearly dont fit. But if this occurance was daily, I bet our cities would only build parking houses too instead of parallels
Most places I have lived in the U.S. have plazas, giant parking lots, with stores that loop around 2 sides into a corner for the most part. They aren’t designed to be walked to. Bicycling to them is often tough as well. The mom and pops shops are mostly dead, so groceries, appliances, movies, whatever it is you are looking for are in Walmart, Target, Bestbuy, and other failing stores like Macy’s, Dillard’s, JCPenney, etc. all resteraunts are either surrounded by a parking lot, or in a plaza. Fast food is everywhere, and neighborhoods are miles from stores. The jurisdictions don’t allow commercial propertys near many neighborhoods. Slowly we are seeing more mix, but it’s a last 10 year change that I have noticed.
One of the big reasons for the stupid size of parking lots around stores has to do with zoning laws as well. I don’t remember the numbers and it’s gotta vary by district, but it’s tied to a certain percentage of the max occupancy of the building.
Because of the car-focused infrastructure that puts everything else last, we’ve created a self-defeating system that forces people to drive everywhere, thus justifying the massive parking lots that prevent people from using other modes of transport in the first place.
Yet, Washington has one of the lowest rates on this scale. Maybe it’s because you have to go to driving school if you want a license before 18?
the local driving schools (plural, there are a bunch) use the park nearby to teach parallel parking. I don’t think the avg driver in WA parks any worse than texas, illinois, virginia, ca or ny state. YMMV there are outstanding assholes everywhere, but I do have the privilege of a large number of places lived / driven.
yes but whole africa is developing nations with ultra bad infrastructure like roads and intersections. You should be comparing USA to peering nations, like western europe or countries of the commonwealth. Unless you admit that USA is also third world shit hole
Saudi Arabia, WTF?
You can always count on Mississippi! I’m surprised Texas isn’t higher, we drive like maniacs.
New Jersey is too low. Serious doubts about the validity of this table.
Probably not. The state has been implementing Vision Zero as a statewide program along with several cities.
The two major highways have lower than average accidents due to design.
One of the state’s signature traffic configurations, the Jersey Jughandle, eliminates left turn movements on older highways, a major source of accidents.
It’s comparing against total population, not driving population, so any amount of mass transit will greatly reduce this number
Jersey is best state, 100%.
I’d like to see the % of trucks vs cars for each location.
The south is killing it!
Not surprised by SC, as a Canadian I had one accident in 40 years of driving, it was in SC, caused by a 17yo girl driving an old suburban or something.


